
Please wait...
01
"Discover the Science Behind Smart Property Choices."
02
"Invest Wisely, Live Better with PropertyScience."
03
"Unbiased Advice, Data-Driven Results."
04
"The Smarter Way to Find Your Perfect Property"
Real estate dynamics are highly influenced by the neighbourhood dynamics. The price, products and liveability index is depended on the economic profile of the neighbourhood of the property.
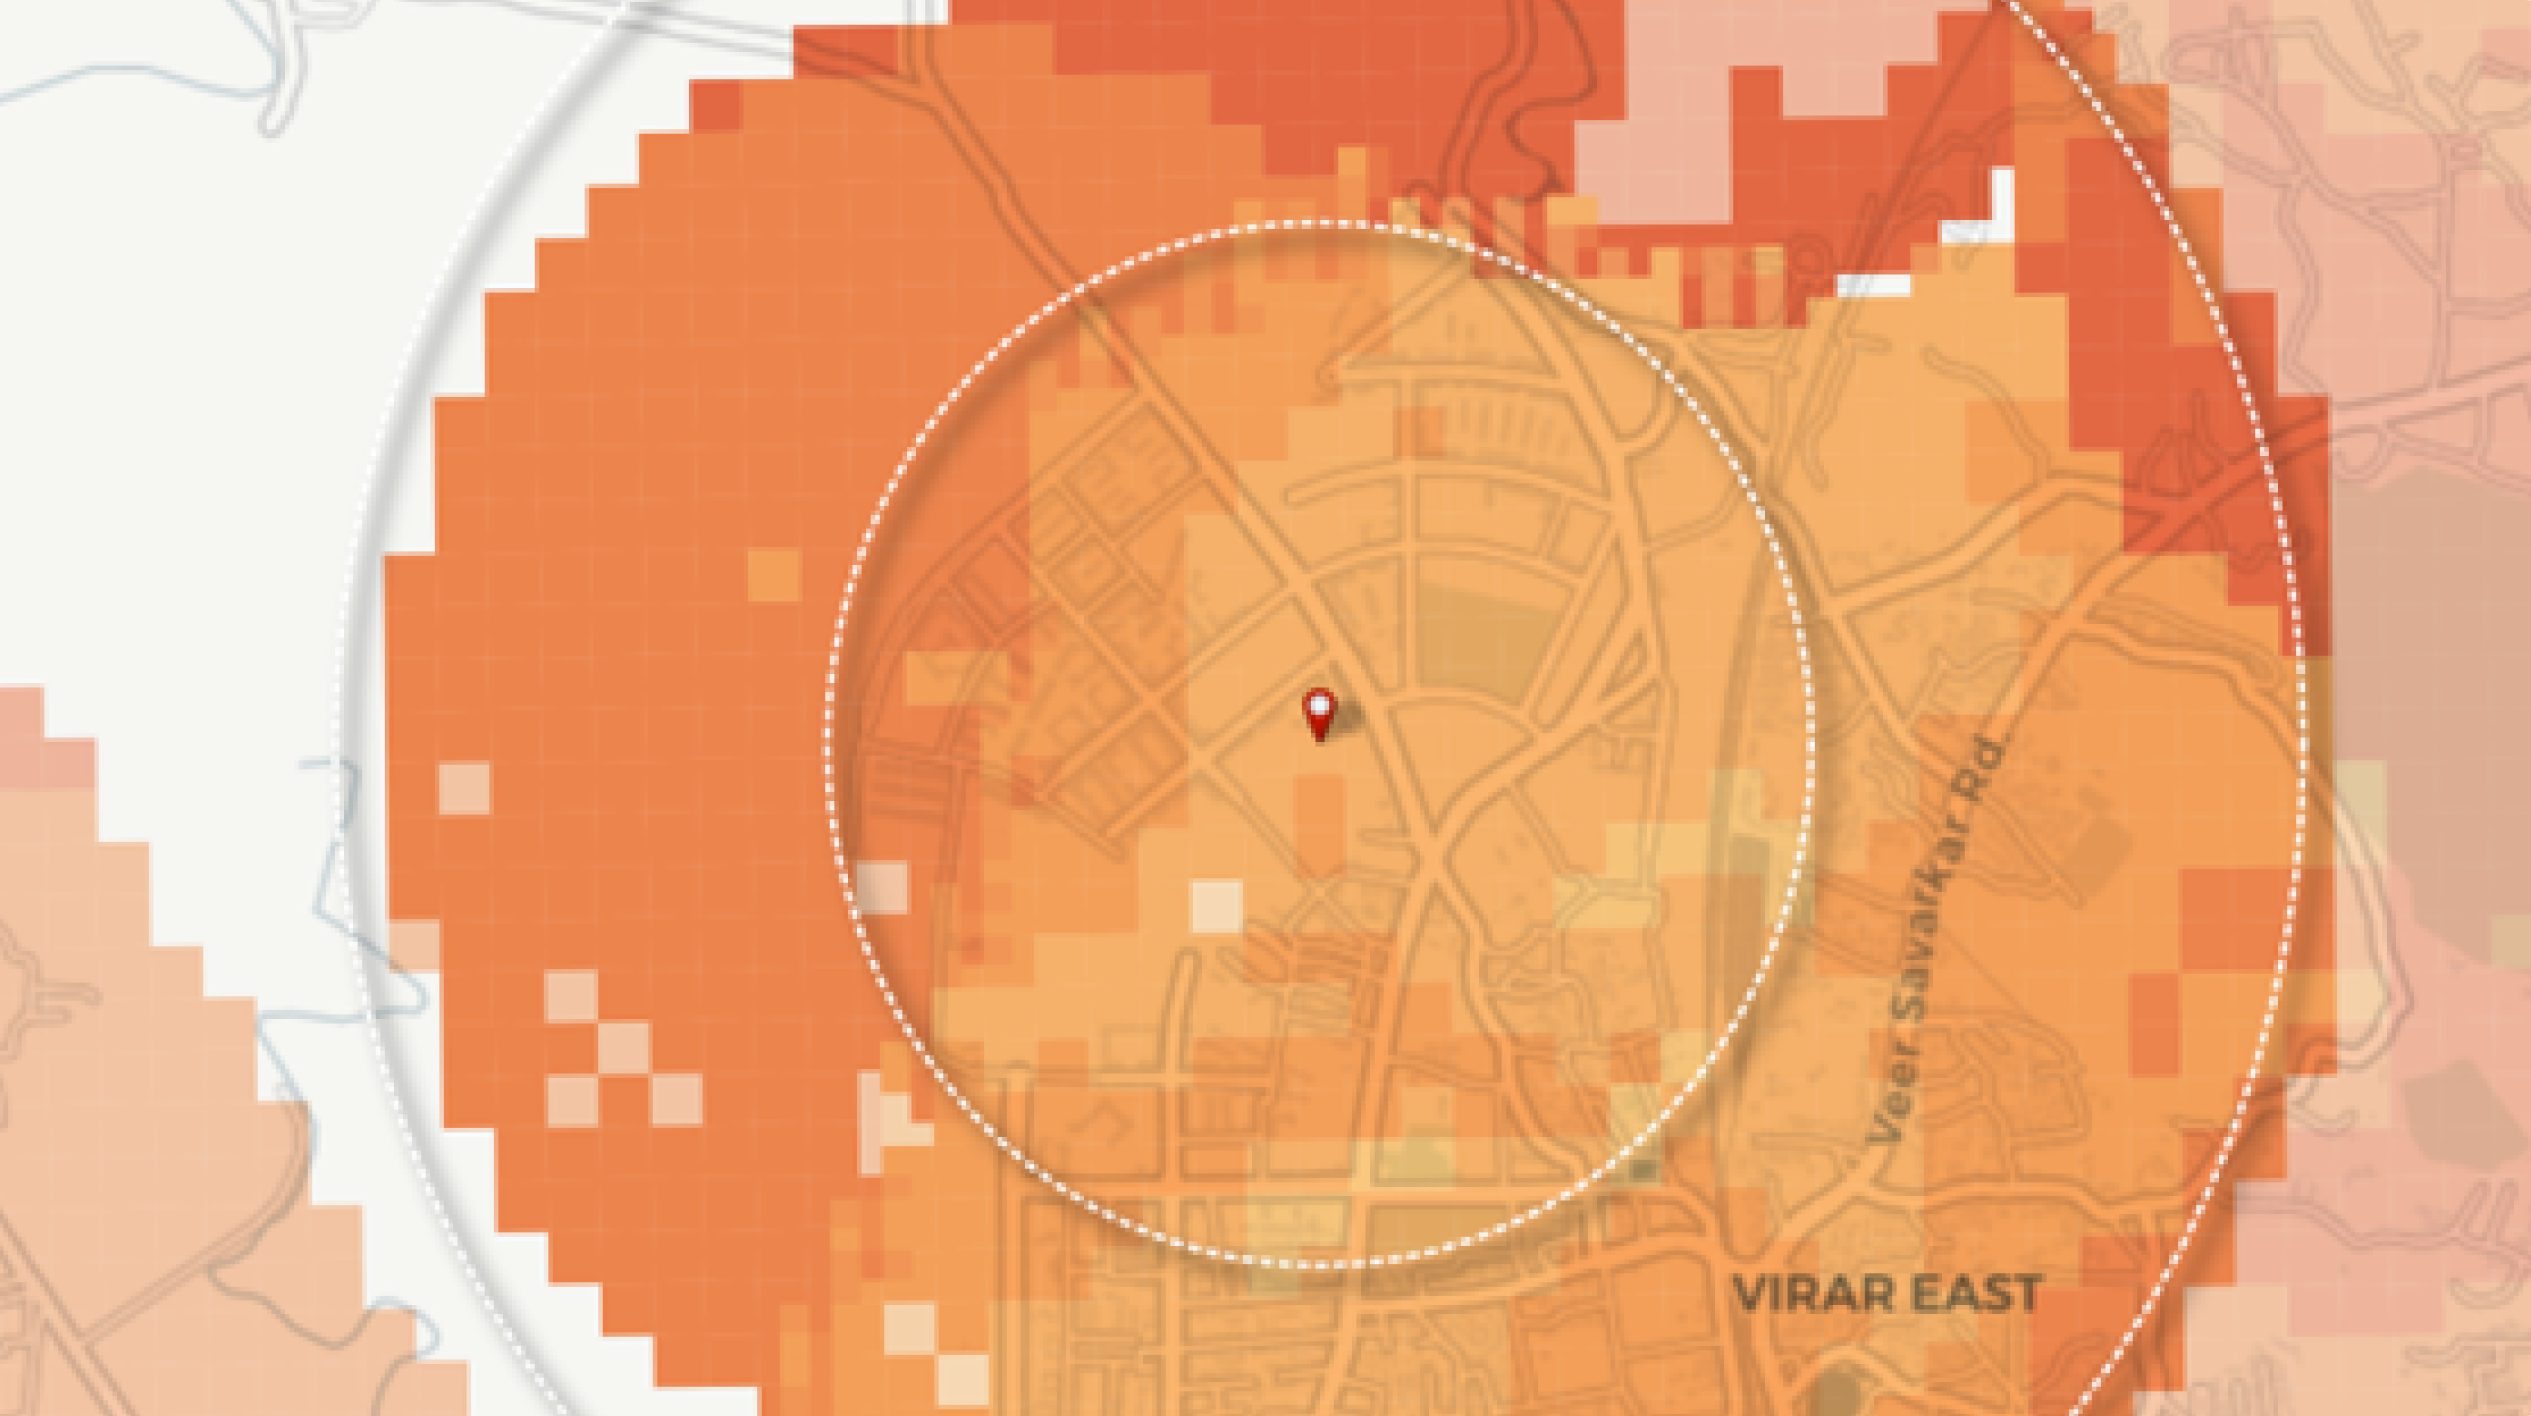
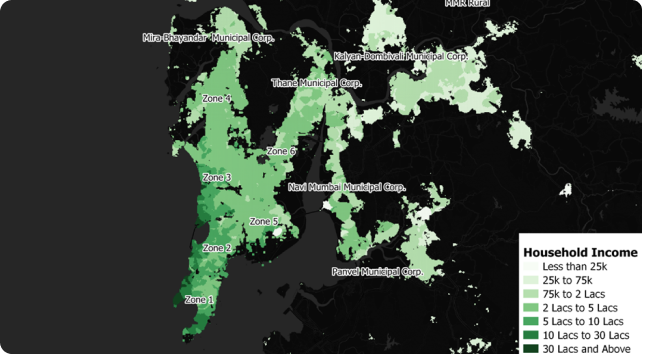
Liases Foras has developed population, their income classification and affluency index for a scale of 100 meter by 100 meter of a grid covering the entire cross section of all the 60 cities. The layer of demography allows you to see how is the income group of the people in the neighbourhood of the location and also see the affluency index that indicates the quality grade of the neighbourhood/ locality.
The plane is divided into grids of 100mX100m and the population is distributed based on the urban settlement identified in each grid, along with estimated income of households based on apartment costs, the income profile of the households in the area can be mapped.
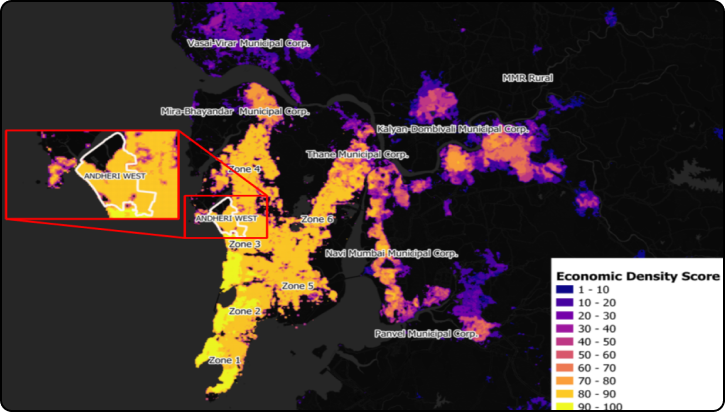
Economic Density (ED) represents the quality index of a locality which is measured as household density multiplied by the income of those households. Higher the ED, better the demographic profile of that area. Since better demographic also ensures the availability of quality of social infrastructure, ED can represent the location quality directly. Each city has its own characteristics determining the location quality, hence a relative ED scale fits best for determining the hierarchy of location quality.
Lorem ipsum dolor sit amet, consectetur adipiscing elit, sed do eiusmod tempor incididunt ut labore et dolore magna aliqua. Ut enim ad minim veniam, quis nostrud exercitation ullamco laboris nisi ut aliquip ex ea commodo consequat.
Follow Us
© PropertyScience 2024 | All Rights Reserved